Biology: Determining Cognitive States Using fMRI Data
Posted 25 days agoData Source: http://www.cs.cmu.edu/afs/cs.cmu.edu/project/theo-81/www/
In this post, we reproduce the analysis of fMRI data to see if we can determine the cognitive state of a subject when they are either viewing (1) a sentence or (2) a picture. fMRI snapshots were taken and the activity of 4698 voxels (3D pixels) were used as columns for analysis. Naive bayes was used for analysis. Although individual snapshots are not independent, prediction using trained model yielded an accuracy of 0.94871. Below are the aggregated values of snapshots labelled as 'Picture' or 'Sentence'.
Picture Viewed by Subject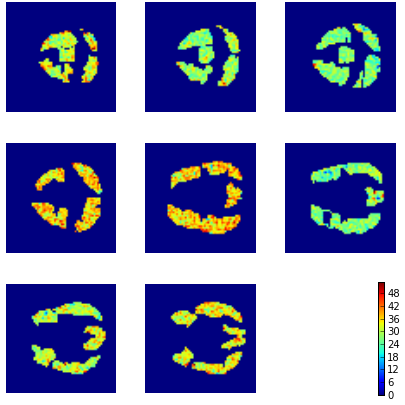
Sentence Viewed by Subject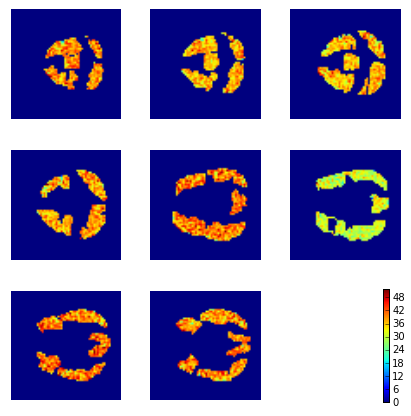
#Imports used
from scipy.io import loadmat
import numpy as np
import pandas as pd
from matplotlib import pyplot as plt
from sklearn.naive_bayes import GaussianNB
#Read in Data
ids = ['04820']
total_data = []

data = loadmat('data-starplus-' + ids[0] + '-v7.mat')
meta = data['meta'][0][0]
info = data['info'][0]

colToCoord = meta[0]

labeled_data = []
for trial in xrange(meta[6]):
    #Ignore rest periods in data
    if info[trial][0][0][0] in [2, 3]:
        #Determine whether trial started with a picture or sentence
        testType = info[trial][13][0]
        voxes = data['data'][trial][0]
        for i in xrange(len(voxes)):
            if i/10 == 0:
                labeled_data.append((voxes[i], testType))
total_data = total_data + labeled_data

X = pd.DataFrame(map(lambda x: x[0], total_data))
y = np.array(map(lambda x: x[1], total_data))
#Create Test Data
mask = np.random.rand(len(y)) < 0.8

X_train = X[mask]
X_test = X[~mask]
y_train = y[mask]
y_test = y[~mask]
#Run Naive Bayes
gnb = GaussianNB()
y_pred = gnb.fit(X_train, y_train).predict(X_test)
print sum(y_pred == y_test)/float(len(y_test))
def recreateImages(temp_image, layer):
    img = np.zeros((64, 64))
    snap = temp_image

    #Normalize image values
    maxActiv = max(snap)
    minActiv = min(snap)
    snap = snap - minActiv
    snap = (snap * 63/(maxActiv - minActiv)) + 1

    for i in xrange(len(snap)):
        coords = colToCoord[i]
        if coords[2] == layer:
            img[coords[0]][coords[1]] = snap[i]

    plt.imshow(img, cmap='jet')
    plt.axis('off')

translation = {'P': 'Picture Shown', 'S': 'Sentence Shown'}
for i in ['P', 'S']:
    to_img = X_test[y_pred == i]
    plt.figure(figsize = (6, 6))
    for j in xrange(1, 9):
        loc = '33' + str(j)
        plt.subplot(loc)
        recreateImages(to_img.mean(axis=0), j)
    #Add colorbar
    plt.subplot('339')
    plt.axis('off')
    plt.colorbar()

    plt.tight_layout()
    plt.show()